Tracking Layers Through the Season?

For those who’ve been recreating in the backcountry for more than a few years, how are you logging/tracking individual snowfalls/events to stay aware of potential hazards through the season? Especially if life doesn’t allow you to get up into the mountains daily to keep track?

With this nice early-season snowfall, no doubt everyone is excited for a great season. But looking at the long-range models, we’ll see a lot of modification of this snow over the next 10+ days through all of the processes (blowing, sublimating, compaction, melting, etc.), which has the potential to make for a very faceted ground-level layer that may become a pesky deep persistent concern through the season, especially on those north aspects. Perhaps IPAC will start labeling it something like “the October Trick (or Treat)” or similar to key us in on the layer and dangers if it’s significant enough, but that’s also not their responsibility.

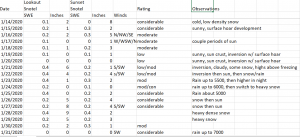
So, what process do you follow? Spreadsheets? Phone logs? Notebooks? Stickies on the dashboard? Daily checks & logging of the resort snow boards/reports? SNOTELS (one or mulptiple)? Something else?

For those of you wondering where this is coming from, as I sit here at my gig at the airport (I wrote this Saturday night, 10/24/20, while recently deeply immersed in the work of the Bruce's, Kay and Tremper), one of our responsibilities is measuring the snow depth and tracking the water content of that snow column. In just 12 hours, the snow field has gone from average of 7” deep to just over 4” deep, through most of those processes listed above; the process is also happening in the mountains, although probably slower. Here in the valleys, it won’t survive the week, except in the shaded areas. It will quickly fade from memory, even those areas that persist and get buried once winter is really here. But they’ll still be there.

Thanks.
 

PowderPanda

Staff member
The logging is the easy part Bill. Take notes in your field book.
Here's the dirty though, I won't write down this snowfall personally as there isn't anything really to set it up for description. This all will settle out. we'll probably have some surface hoar development in shaded areas, north face. But that depends on temps and if there is rain, wind, heavy wet snow.. so many variables.
After the next storm comes and builds on this, that's when the data really begins.
This snow MAY become a shit base layer that perpetuates as the season moves forward. Or, we get some heavier new snow, that builds up, some rain percolates through and than refreezes, reseting the snowpack.
It is important to get out and just know what's going on with the pack early, but the data recorded going forward would be at least after the next big storm or two.

Cheers,
PP
 
Thanks Larry. I'm just mulling over concepts more than anything as we prepare for the season.

You'll love Jen's comment today in the dentist's parking lot where they had a small mountain of plowed snow from last weekend. She saw it and said "dang, we should have had our avy shovels. That's set up like debris!" Although I suspect the dentist would have been a bit pissed that we dug for a victim.
 

PowderPanda

Staff member
Thanks Larry. I'm just mulling over concepts more than anything as we prepare for the season.

You'll love Jen's comment today in the dentist's parking lot where they had a small mountain of plowed snow from last weekend. She saw it and said "dang, we should have had our avy shovels. That's set up like debris!" Although I suspect the dentist would have been a bit pissed that we dug for a victim.
Hahaha.. I have an old avy shovel in my car for when I need to dig, or get stuck..
 
Hey Bill,
Thought I would weigh in as well as a fellow weather nerd. I keep a simple running excel spreadsheet of just what you are talking about. I had actually started doing this (minus the rating) before I started forecasting, now it's invaluable to me to keep track of stuff since I'm only a quarter time forecaster. And yes, I will label this snow October Trick (or Treat), thank you. :) For me, I have started this early in the season keeping those records, even if it is just the first layer and it melts everywhere. It was invaluable to me last year when I had to go backwards through weather data to build a detailed timeline leading up to events in January. I had the notes that there was September and October snow, and that it melted mostly, but not everywhere, and subsequently knew which weather stations and dates to search to pull the hard data. Early season I use the webcams as well as informants (friends with views of peaks) to know where the snow is staying. Another bonus, I've received flood mitigation funding by using my winter records about rain-on-snow events.

If you are doing a bunch of weather obs or magic during your money gig, feel free to send them my way! Now that I think of it, what do you think of doing an online talk for IPAC about all the different weather options that are available for people to look at and how to use them?? I'm sure there is a bunch you could teach all of us!
upload_2020-10-29_13-14-25.png
 
Melissa,

You completely had me at "spreadsheet!" That's what I do. For everything!

Thanks for the sample that I can build off of. For example, I would include the 850mb (~5,000') and 700mb (~10,000') winds and temperatures off of the morning NWS balloon sounding (it pops up with the default Norman, OK, so you'll have to click on Spokane in the upper left corner) just to get a feel for transport warming/cooling trends at sunrise that day. But that's the nerd in me.

Hey Bill,
Thought I would weigh in as well as a fellow weather nerd. I keep a simple running excel spreadsheet of just what you are talking about.

If you are doing a bunch of weather obs or magic during your money gig, feel free to send them my way! Now that I think of it, what do you think of doing an online talk for IPAC about all the different weather options that are available for people to look at and how to use them?? I'm sure there is a bunch you could teach all of us!
View attachment 4647
All of our obs are publicly available in either the raw or decoded formats - KGEG Observations. Naturally, they are aviation-centric, although we're the official precip measurement site for Spokane and will likely tally totals lower than the mountains. No magic involved.

For KGEG, snowfall and snow depth are measured every 6 hours and SWE is measured once per day

As far as an IPAC talk, I suspect the most that I would do would be to cover the weather page here on Panhandle Backcountry, since it's so comprehensive (Great work @idsnowghost & @PowderPanda !), although we could talk strengths and weaknesses of some of that data or apps that users might be inclined to use. Anything additional I might add would be well outside the scope of what IPAC would probably want to offer (like the balloon data above). But if you're thinking something else, let me know.

BTW, it's great to hear that you nabbed some additional funding!
 
Awesome, thanks for sharing your spreadsheet!

May consider utilizing Sentinel-2 imagery for tracking the lingering early season snowfalls: https://apps.sentinel-hub.com/sentinel-playground/

Caltopo also provides access to that imagery in their premium levels.
Thanks for that link, Mike. I'll have to play with it, as visual/infrared satellite imagey is problematic around here with so much cloud cover.

My go-to from our PCT thru-hike days is over at Postholer, using SNODAS imagery, which is microwave-based, only marginally effected by cloud cover. You can pick between depth and SWE. Granted, it's still remote-sensed and not as good as direct, on-the-ground measurements, but it gives a pretty darn good idea throughout the season.
 

idsnowghost

Staff member
SNODAS is a good tool, but has some limitations also. I agree it gives a good general idea. However, I've found accuracy to be lacking when comparing to imagery or just my own field obs. (SNODAS currently is missing the snow on Lookout's North side competely for example) It's also a modeled 1km grid rather than just raw remote sensed data.

Thanks for the Posholer link! Cool site. (The layer is also available on Gaia (and linked on our WX page!))
 
SNODAS is a good tool, but has some limitations also. I agree it gives a good general idea. However, I've found accuracy to be lacking when comparing to imagery or just my own field obs. (SNODAS currently is missing the snow on Lookout's North side competely for example) It's also a modeled 1km grid rather than just raw remote sensed data.
Yep, that's one problem of many with all of these remote-sensed tools. Honestly, I can't keep track of all of the strengths/weaknesses of just the weather models, much less each of the microwave channels of the satellite data (and I used to teach that stuff). The amount of data available now is insane, especially compared to when I started this line of work in the late '80s.

Unfortunately, the average bear has access to these tools (not the unfortunate part), but has little to no inkling (or care) about the strengths and limitations (that's the unfortunate part). But they'll use the information on that their app shows on their screen as an anchor for the day's decision-making. That's a concern.

Having said all that, I'm really looking forward to the MSU Snow and Avalanche Workshop presentation on the 16th, when they cover satellite sensing of avalanches and LIDAR snow mapping. Yep, I'm a nerd.
 
Thanks for this!
Is there anything similar that pilots would use as a resource further north up in the Panhandle?
Sure thing. This link brings up a map. Click on the symbology for the location that you are interested in, then select either "3 Day" or "7 Day" at the bottom to look at the archived observations. The amount of information there depends upon which type of sensor is located there.

Just know that even though the map defaults to show all sensor networks, it doesn't show all sensors. For example, on this map, you can look at the information for the weather sensor at the Mulan Pass FAA navigation site at the top of the "Training Area" across from Lookout Pass Ski resort, but it doesn't show the SNOTEL sensor that sits on the slopes of the resort. So you'll still have to piece info together. Nor does it show the sensor down on I-90 milepost 0.2 that is linked on the weather page here.

With that I'll still give a plug for the weather page here on this site. They've done a great job of compiling so many of these relevant links.

edit — re: the second paragraph, to see all of the sensors, find the "Observations" tab on the Overlays panel on the right side of the screen. On the "Density" line, toggle the "all" option. In my example in the second paragraph, you'll now see all four sensors around Lookout Pass.

And if you're talking specific aviation-related information, never, ever, make VFR/IFR decisions based on this data.
 
Last edited:
Sure thing. This link brings up a map. Click on the symbology for the location that you are interested in, then select either "3 Day" or "7 Day" at the bottom to look at the archived observations. The amount of information there depends upon which type of sensor is located there.

Just know that even though the map defaults to show all sensor networks, it doesn't show all sensors. For example, on this map, you can look at the information for the weather sensor at the Mulan Pass FAA navigation site at the top of the "Training Area" across from Lookout Pass Ski resort, but it doesn't show the SNOTEL sensor that sits on the slopes of the resort. So you'll still have to piece info together. Nor does it show the sensor down on I-90 milepost 0.2 that is linked on the weather page here.

With that I'll still give a plug for the weather page here on this site. They've done a great job of compiling so many of these relevant links.

edit — re: the second paragraph, to see all of the sensors, find the "Observations" tab on the Overlays panel on the right side of the screen. On the "Density" line, toggle the "all" option. In my example in the second paragraph, you'll now see all four sensors around Lookout Pass.

And if you're talking specific aviation-related information, never, ever, make VFR/IFR decisions based on this data.
Thanks Bill!
 
Top